Module 6 - Wizard Window User Manual
OptaSense OS6 Wizard Window
Once the software is running, and the initial configuration has been completed, the main settings of the system are set, allowing the software to be used. To ensure that the software is fully configured, it is recommended that a wider range of settings are checked in the Wizard Window
Access to the Wizard Window is from the menu bar via Configure > Wizard > Wizard Window, as shown in Figure 1. Alternatively, the operator can use the global search function to access the Wizard Window or any of its available settings.
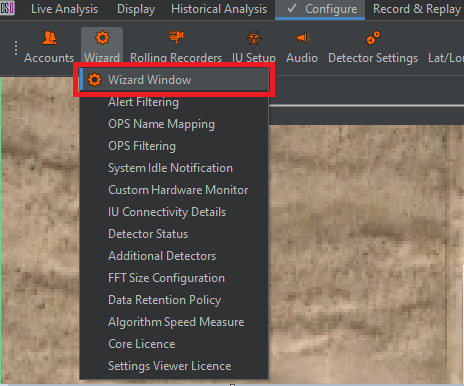
Figure 1: Location of Wizard Window within menu-bar
Once the Wizard Window has opened, the operator will be presented with the option to select a category to configure (Figure 2).
Before completing all the configuration items, it is highly recommended to conduct a Config Variables meeting with the end-user to discuss policies for users, groupings, and Control Unit (CU) settings and have these documented.
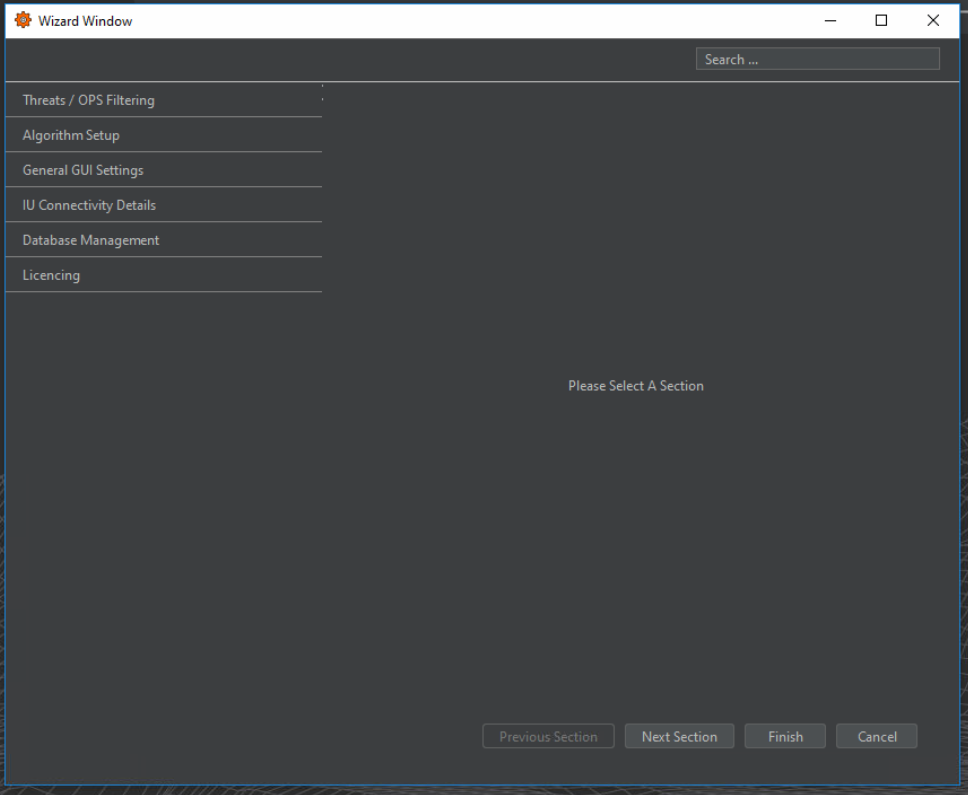
Figure 2: Wizard Window Category view
Threat / OPS Filtering
Alert Filtering
Alert Filtering allows the configuration of the alert types to be displayed (Figure 3). This is unique to the CU that the software is being run on and allows different CUs to be configured for different purposes.
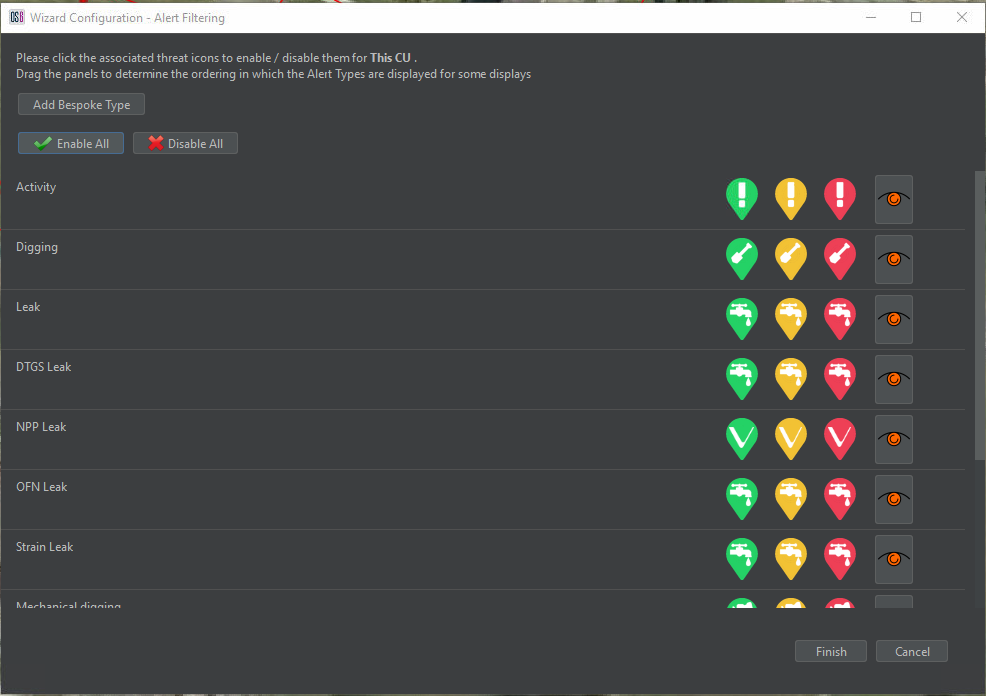
Figure 3: Alert Type Selection
Within Alert Filtering, it is also possible to configure the threat expiry time for each alert type. Select the icon to the right of the high alert icon for each alert to do so. This opens the configure alert expiry time window (Figure 4). From here, times can be altered from defaults and set to permanently display the icon on the map interface (until the alert is acknowledged or dismissed).
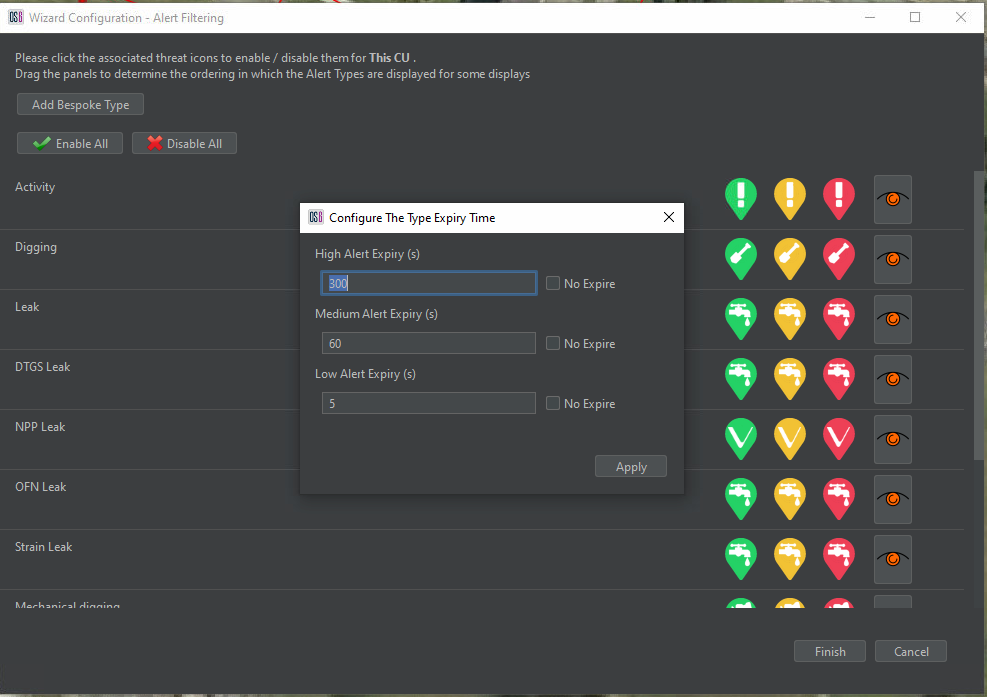
Figure 4: Edit Alert Expiry Time
The operator can also create bespoke alert types by selecting Add Bespoke Type. This enables the detectors to be assigned any threat name desired by the client. The Add Bespoke Type window allows input of a custom threat name (Figure 5). By selecting one of the threat icons, the threat icon selection window opens to allow the selection of the threat icon (Figure 6). Custom images can also be assigned to the alert by selecting Load Custom Image.
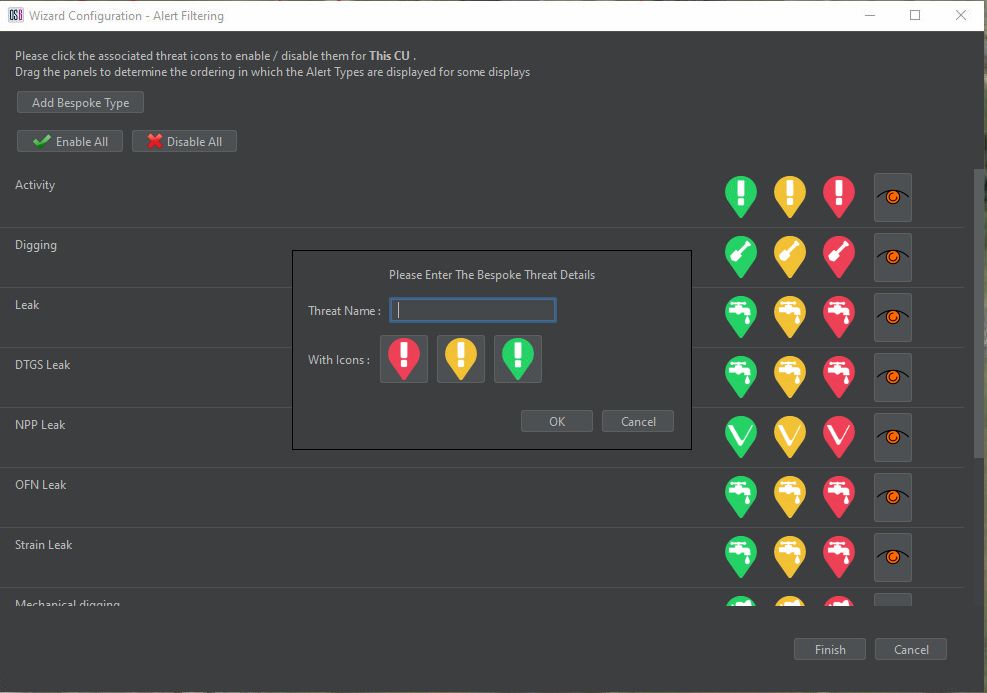
Figure 5: Entering the Bespoke Threat Details
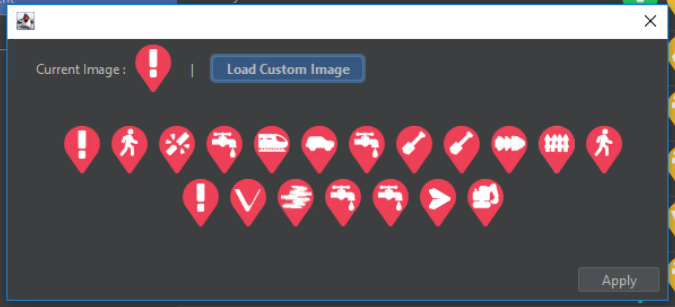
Figure 6: Bespoke Alert Types
OPS Filtering
On a system with multiple OPSs, it is possible to use the OPS Filtering category to disable the OPSs not required on the current CU. These choices are unique to each CU and can be made by disabling an OPS from the list of OPS (Figure 7).
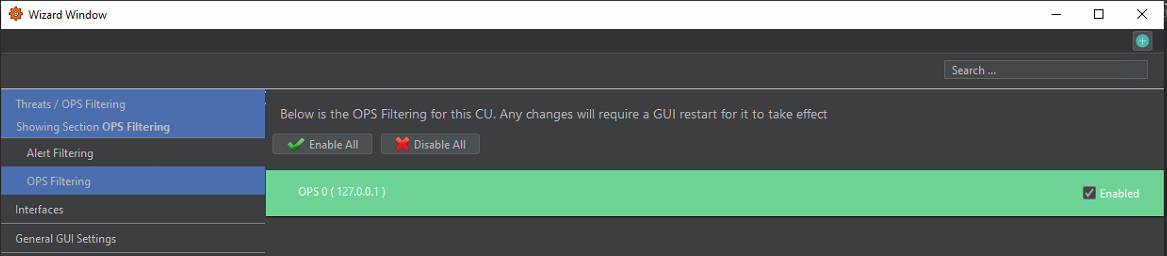
Figure 7: OPS Filtering
Algorithm Setup
Detector Status
Checkboxes are provided to enable/disable detectors for each OPS and to enable/disable the publishing of pre-alerts for relevant detectors. The status of detectors for each OPS can be viewed within the Detector Status tab (Figure 8), as shown in the OPS drop-down list.
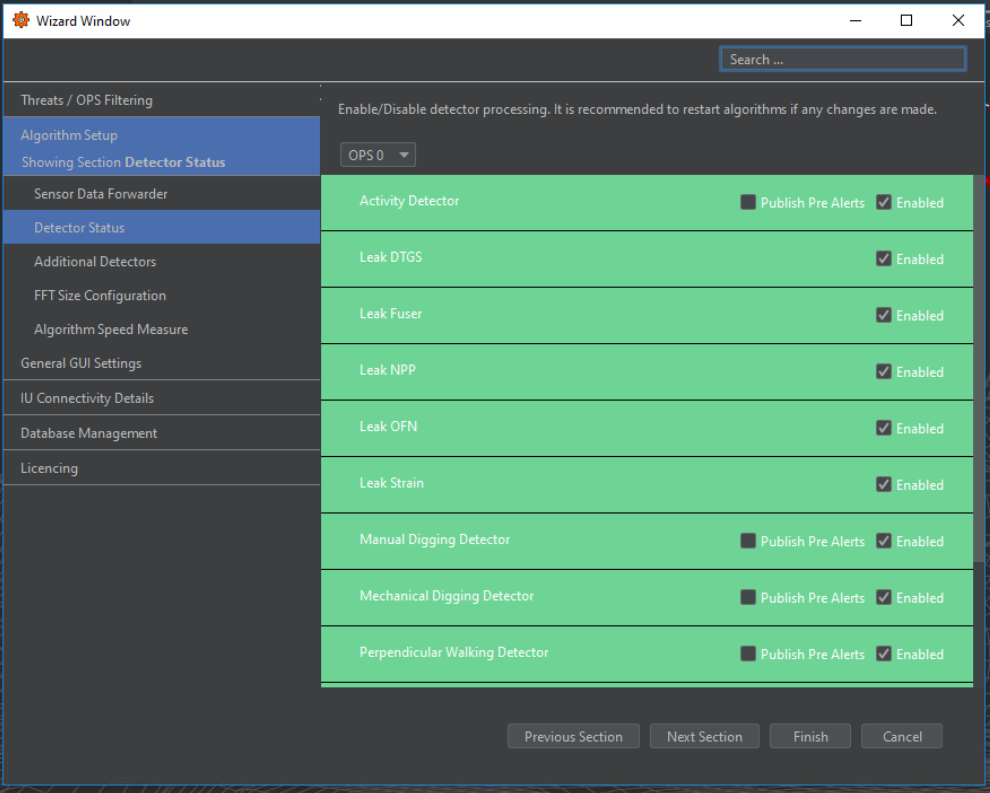
Figure 8: Detector Status tab
Additional Detectors
Additional detectors can be viewed and added to the system through the Additional Detectors tab, as shown in Figure 9. By selecting Add Additional Detector, an additional window will appear where details for the detector can be specified (Figure 10). Detectors must be based on an existing OS6 detection algorithm. The purpose of adding this is to duplicate detectors for different purposes. For instance, in some systems, it may be necessary to run two instances of the NPP detector to allow detection at different speeds.
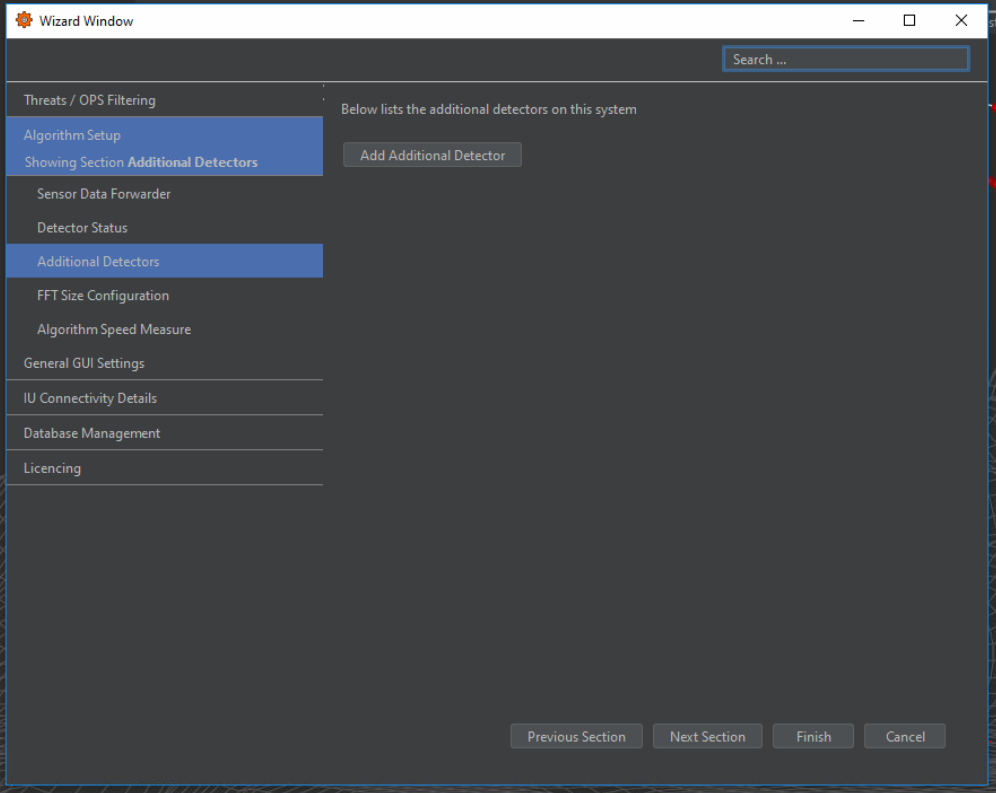
Figure 9: Additional detector tab
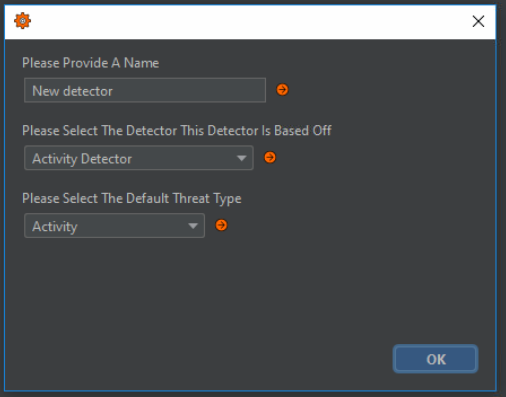
Figure 10: Adding detector
FFT Size Configuration
The system will set the FFT size according to the data sampling rate by default. However, it is possible to override the system and specify an FFT size for each OPS (Figure 11). This may have a negative impact on the system in most cases, so caution should be applied when changing this setting. First, the enable checkbox must be selected before manually inputting the desired FFT size.
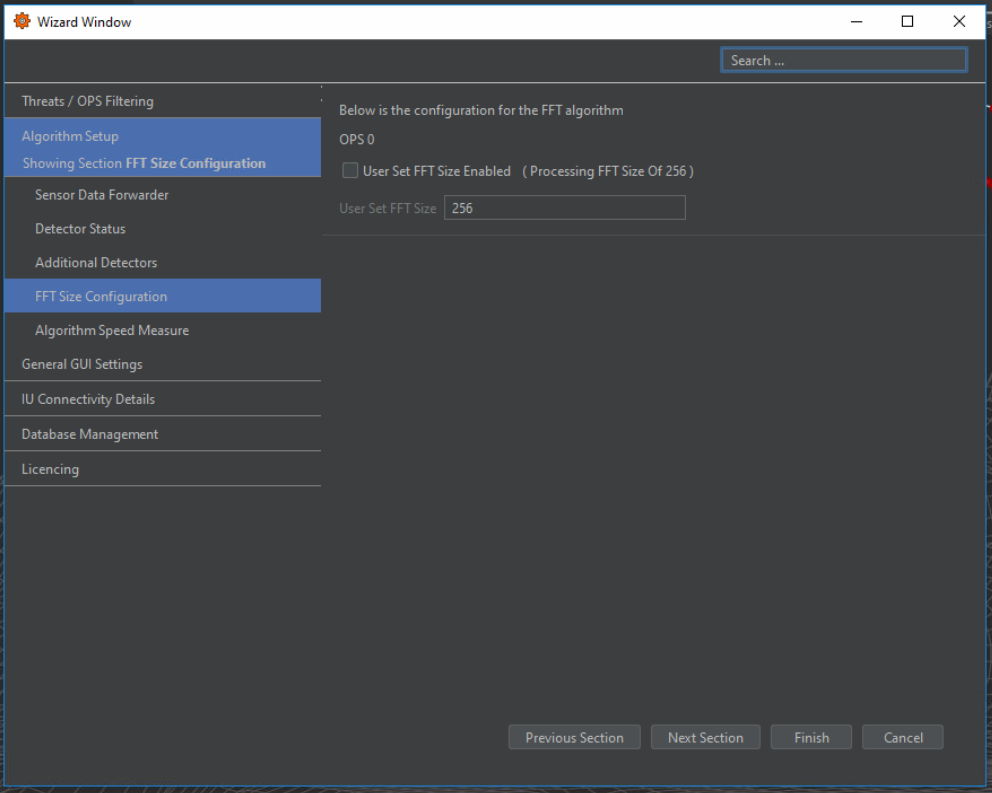
Figure 11: FFT Size Configuration
Table 1 shows the default FFT size for specified sampling rates.
Table 1: FFT Size Calculator
| Processing FFT size selector | |
|---|---|
| Sample Rate (Hz) | Default FFT Size |
| 1666 | 256 |
| 2000 | 256 |
| 2500 | 256 |
| 4000 | 512 |
| 5000 | 512 |
| 10000 | 1024 |
Algorithm Speed Measure
The speed units utilised within the software can be modified to a client’s preference within the drop-box on the Algorithm Speed Measure tab (Figure 12). Anywhere speed is displayed within the software, it will use the specified units.
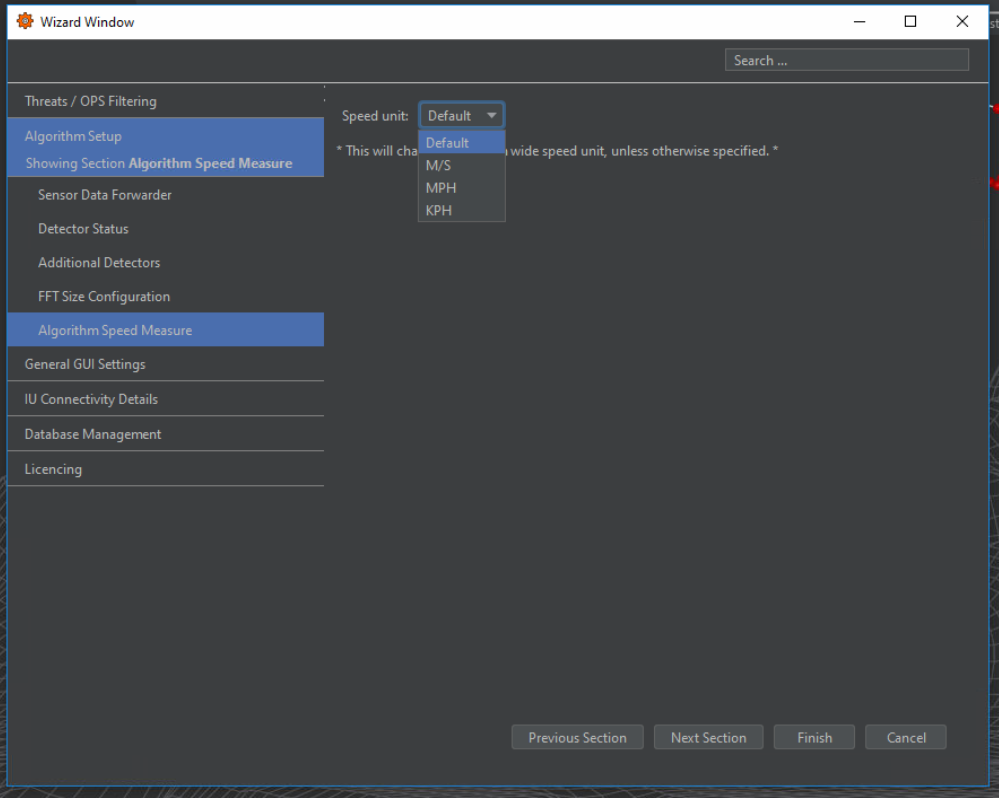
Figure 12: Algorithm Speed Measure Selection
General GUI Settings
OPS Name Mapping
The user can change the name of the OPS rather than using the default OPS number (0, 1, 2, etc.) to a system-specific name. This is configured within the OPS Name Mapping Tab (Figure 13) by manually inputting a custom name for each OPS.
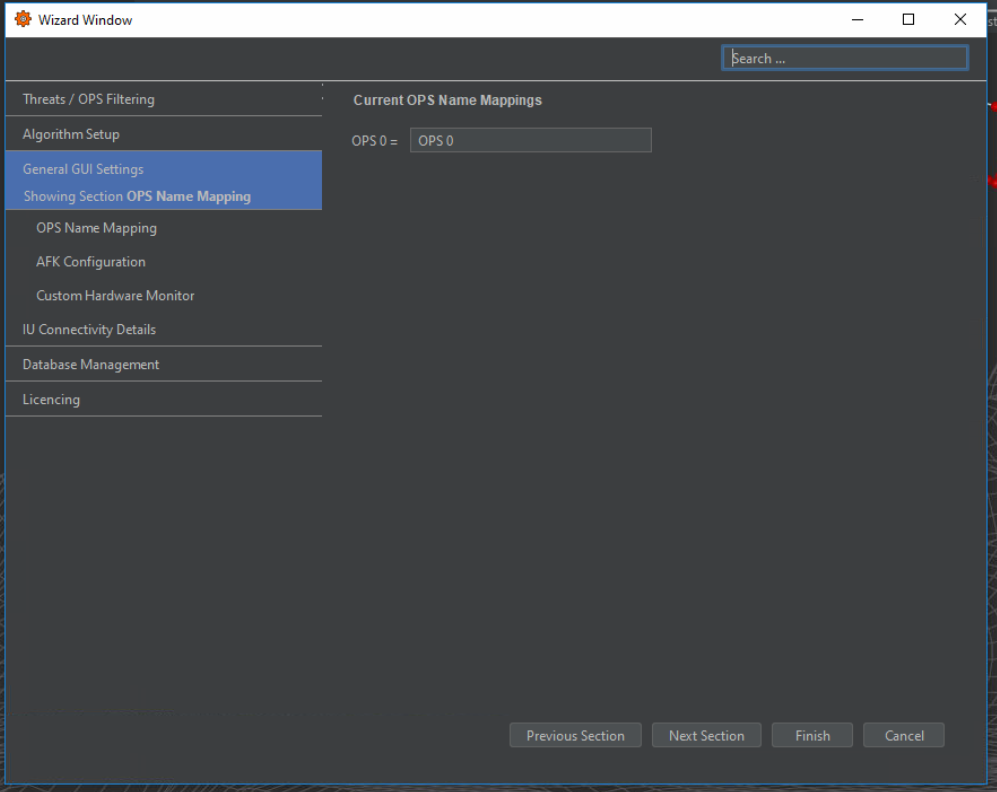
Figure 13: OPS Name Mapping
System Idle Notification
The operator can specify an idle time before the software will display an on-screen message alerting the operator to an unacknowledged alert on the system (Figure 14).
Audio alerts can also be enabled/disabled.
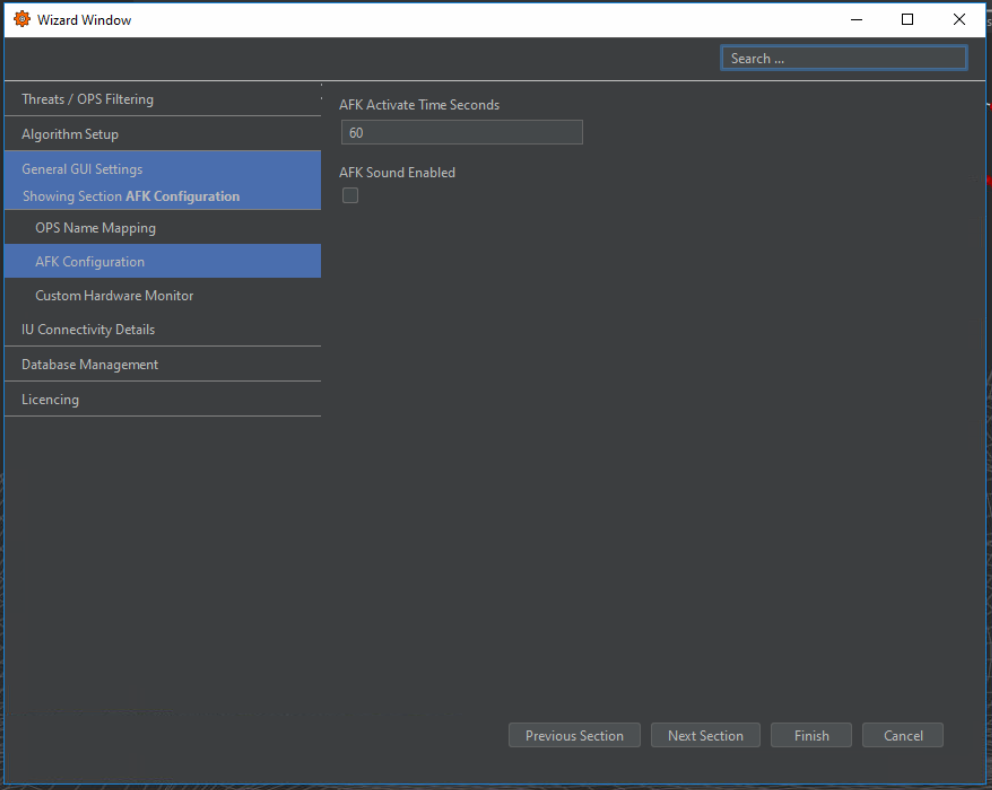
Figure 14: System Idle Notification Configuration
Custom Hardware Monitor
This tab allows the user to Monitor hardware with an IP address on the network. The system will constantly ping the associated IP of the hardware. These can be ECPSs, Managed Switches, etc. By adding these custom hardware items here, they will appear on the system health.
Monitors are added or removed by selecting one of the two icons on the tab, Figure 15. When a new monitor is added or edited, an additional window allows name and IP address input (Figure 16).
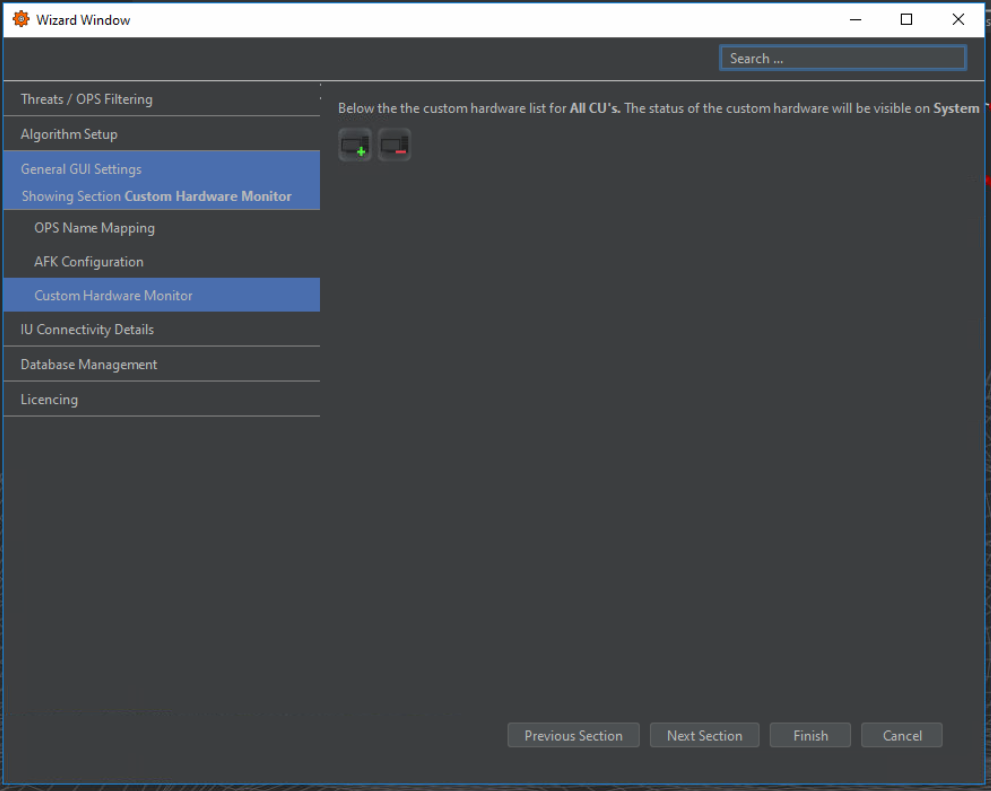
Figure 15: Custom Hardware Monitor
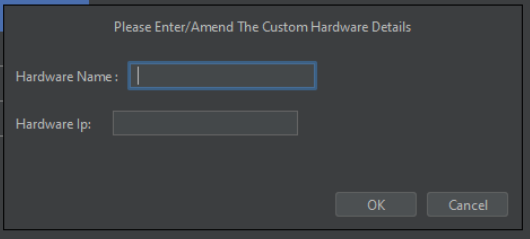
Figure 16: Entering Custom Hardware Details
IU Connectivity Details
The IU Connectivity section of the Wizard (Figure 17) allows the IU type and IP address to be configured for each OPS. The IU type is configured for an entire system rather than per OPS.
The IU type be edited for all IUs by clicking on the IU IP address. The IP address and interface type for individual IUs can be changed by clicking on the IU in the list and selecting Edit Connectivity Details.
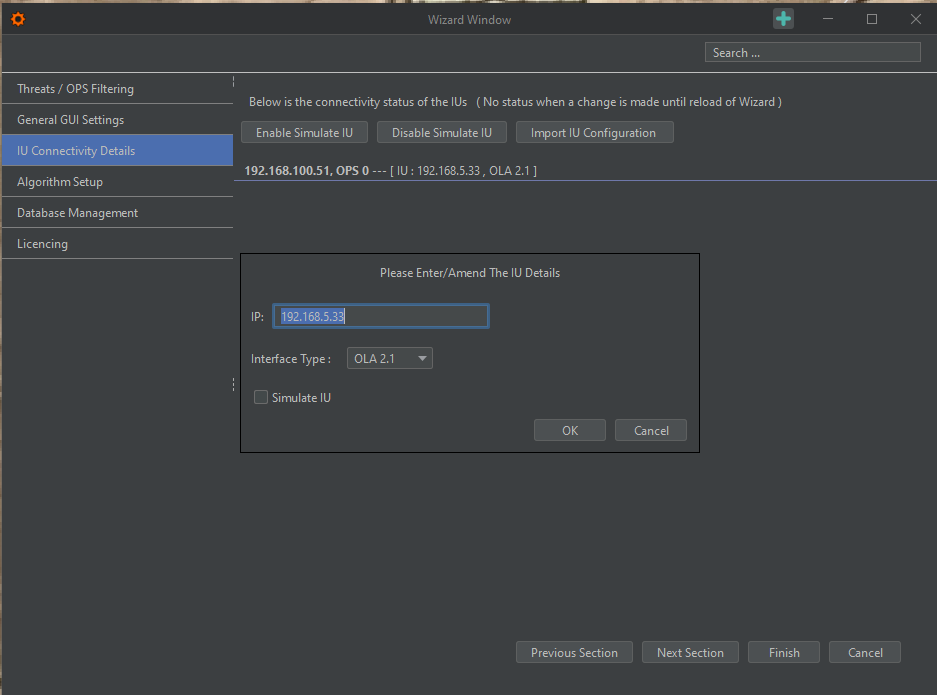
Figure 17: IU Connectivity Details
Database Management
Data Retention Policy
The Data Retention Policy (Figure 18) allows configuration of the length of time that various threats, statistics, and logs are retained on the system. These are accessed by expanding the required section using the drop-down arrow on the right-hand side. The user can then input the desired duration (Figure 19), noting that longer durations require additional overhead that can potentially result in slowdowns or corruption of the database.
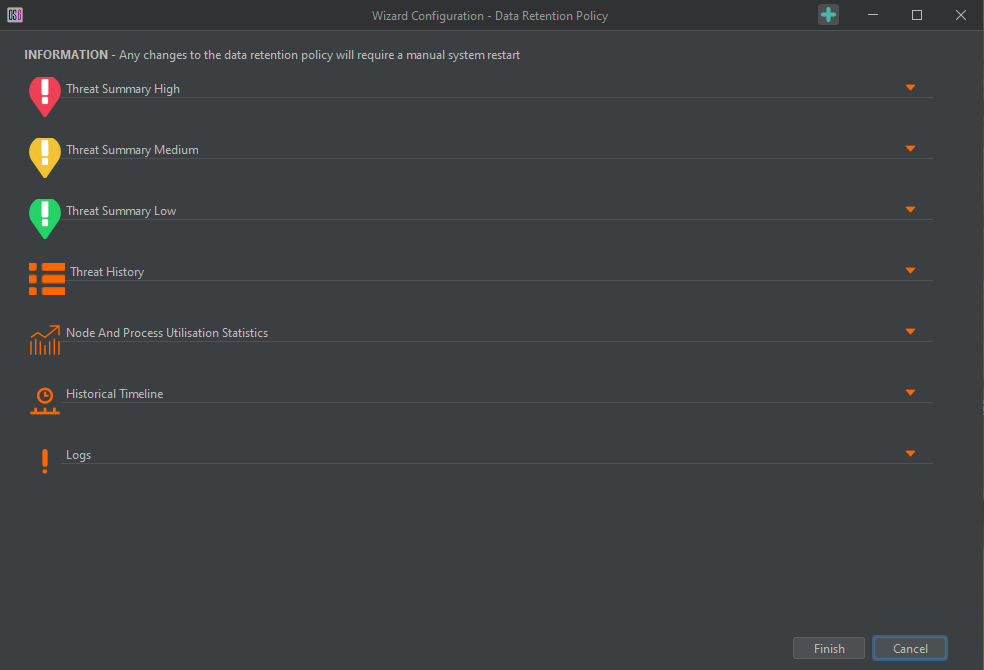
Figure 18: Data retention policy tab
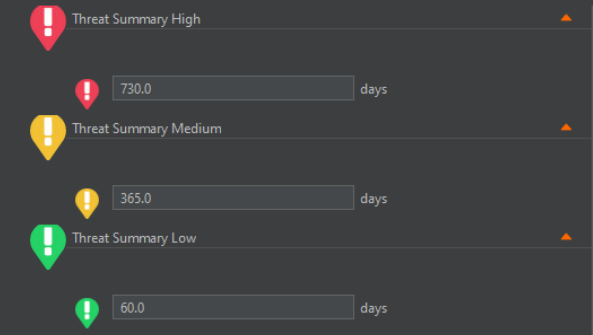
Figure 19: Expanded data retention policy for threat summaries
Diagnostic Reporting
Diagnostic Reporting allows the user to create system diagnostic and health reports automatically. The user can specify how often automatic reports are to be created and the length of time they wish the generated reports to be stored within the database (Figure 20).
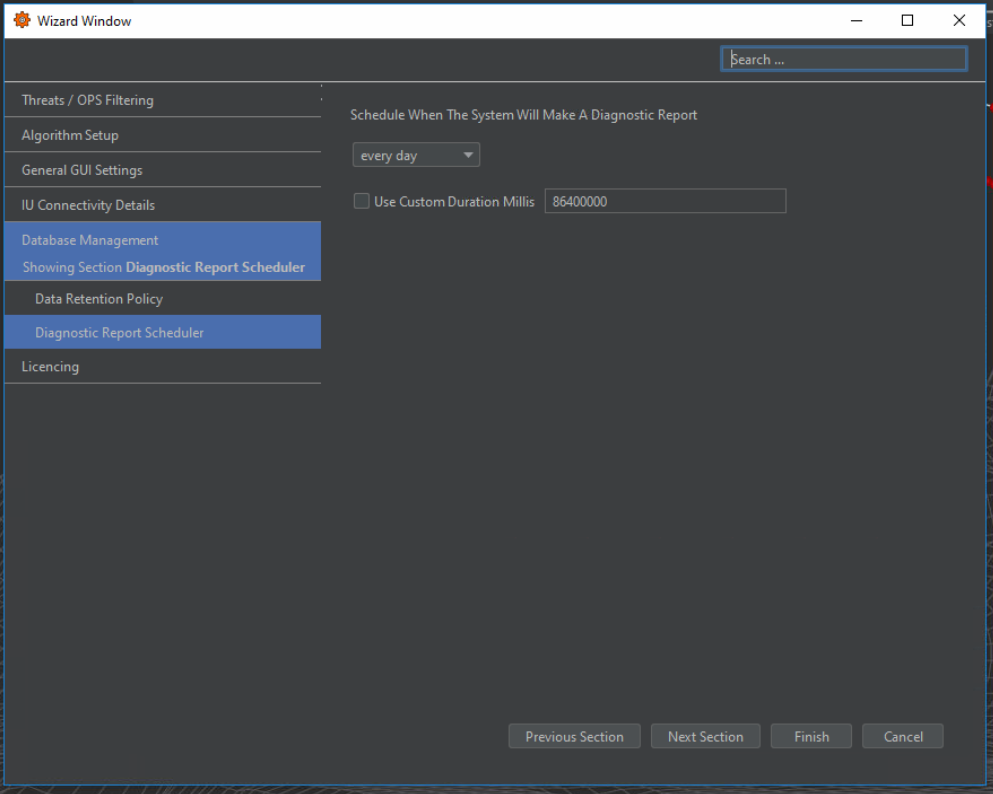
Figure 20: Diagnostic Reporting
Licencing
Core License
The licencing screen allows inspection of the current licence(s) details on the system and upload of updated licences (Figure 21). Replacement licences can be uploaded by dragging the licence file into the licence panel.
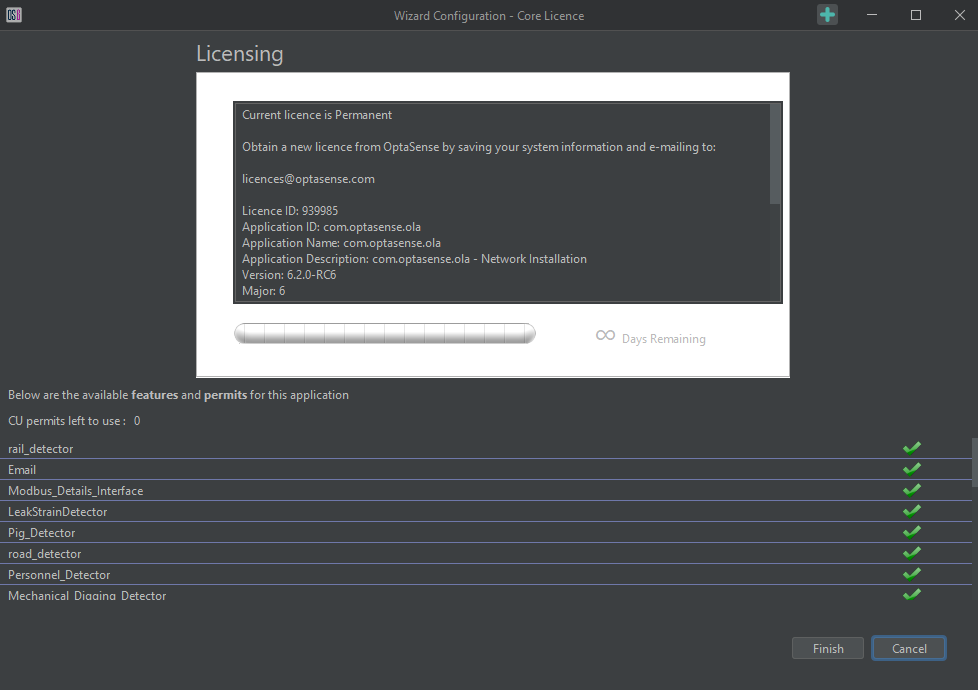
Figure 21: Main System Licence Screen
Interfaces
OptaSense offers a range of interfaces, including HTTP, MODBUS, OPS, Dry Contact, and a Native Camera Interface. These Interfaces will populate within the Wizard as they are added to the system via the System Description Editor (see Module 12 - System Resizing).
Some Interfaces, however including ‘Connect Agent’ do not require adding in the System Description Editor
The available interface controls will depend on which items are licensed to the particular installation and enabled in the System Descriptor.
Further information on the configuration of individual interfaces can be found in Module 8 - Incorporating Ancillary Equipment and Interfaces.